Xiaofei Chen

Portfolio
Loan Default Detector
(github)(deployment)
- Built a Loan Default Detector to predict credit card applicants at risk of default.
- Cleaned and analyzed 300,000 application records. Implemented multiple classification models (XGBoost, LightGBM, HistGradientBoosting), addressing class imbalance by integrating SMOTE and undersampling strategies.
- Orchestrated Hyperopt and MLflow for hyperparameter tuning, achieving a 0.24 PRC-AUC score from the final model, which improved 300% over the baseline, saving 41% charge-off loss (0.41 recall).
- Deployed the model on GCP with Streamlit for internal use, delivering insights for each application prediction.
Supervised Contrastive Learning
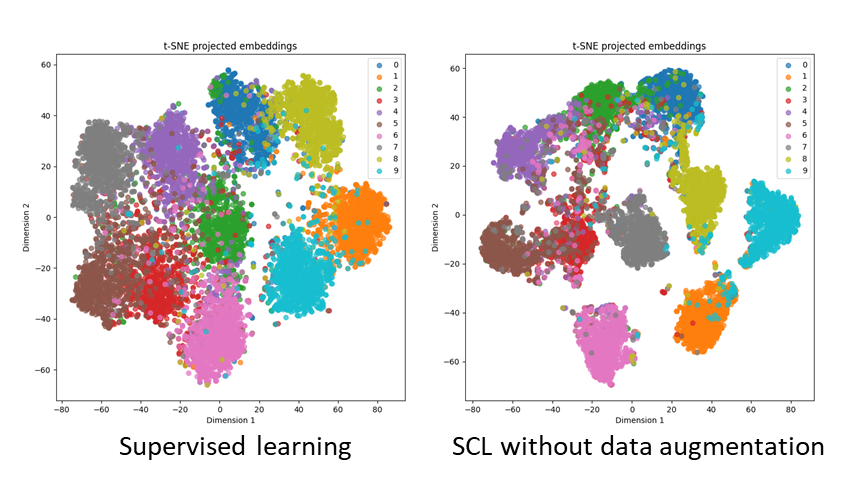
In my Deep Learning course group project (github) I replicated this Supervised Contrastive Learning paper, compared different contrastive loss functions, and analyzed the impact of architecture modifications on network performance, with the hope that supervised contrastive learning can be applied to tabular data to learn informative embeddings. Here are my project report and a notebook dissecting the math behind these loss functions.
City Recommender
- Led a team of 6 to build a content-based interactive recommender system using weighted cosine similarity
- Scraped, merged, and cleaned ~30,000 US cities data with ~80 attributes from three different data sources
- Imputed missing values with k-nearest neighbors (KNN) and performed k-means clustering to evaluate data quality
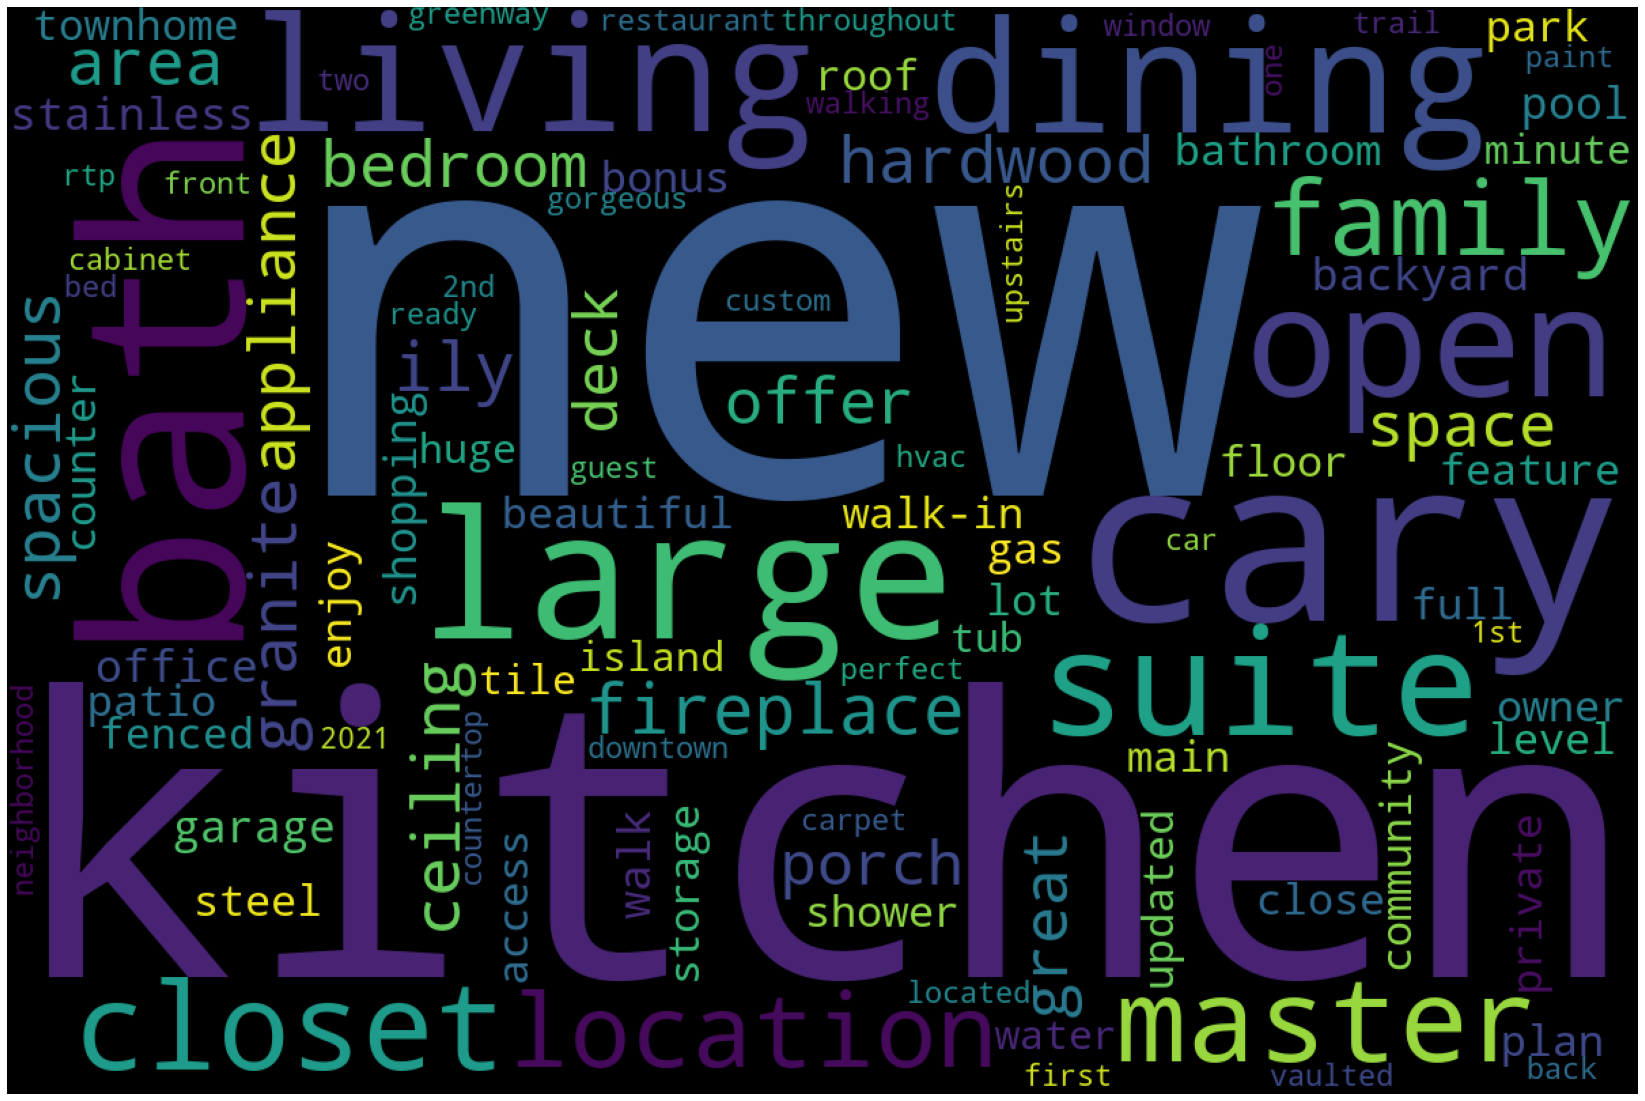
House price prediction
(report)
- Scraped and cleaned ~1,000 local house price data from Zillow.com
- Built regularized linear regression (Lasso and Ridge) and random forest regression models to predict sales prices
- Performed feature engineering using natural language processing (NLP) and improved prediction mean squared error by 9%
US presidential election prediction
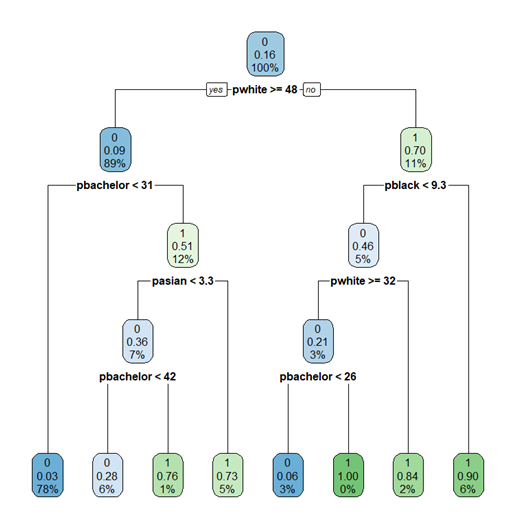
- Led a team of 5 to build regression (linear, random forest) and classification (decision trees, logistic) models to predict 2020 US presidential election outcomes using Census and past election data; achieving 7.1 RMSE for regression and 91.3% accuracy and 94.3% AUC for classification
- Examined trends in demographic factors from 2012 to 2020 and their correlations with election outcomes
Non-linear regression curve fitting
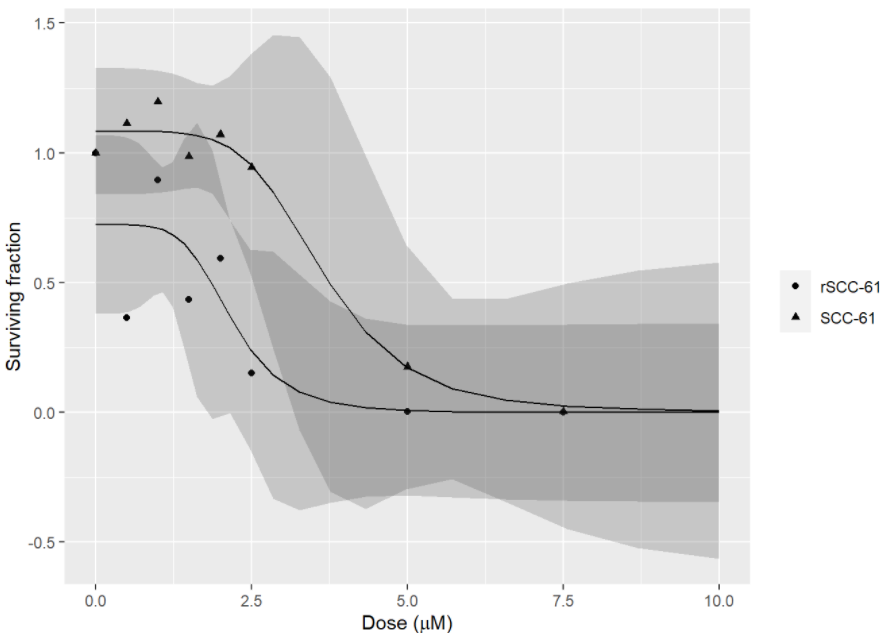
- Used four parameter logistic to study a dose-response curve and calculate the IC50/ED50/EC50 dose (R)
- Used linear-quadratic and multi-target to model cell survival curve after radiation (R | python)
- Used exponential decay increasing to the max to fit a (pseudo) first-order reaction (R | python)
Correlation analysis
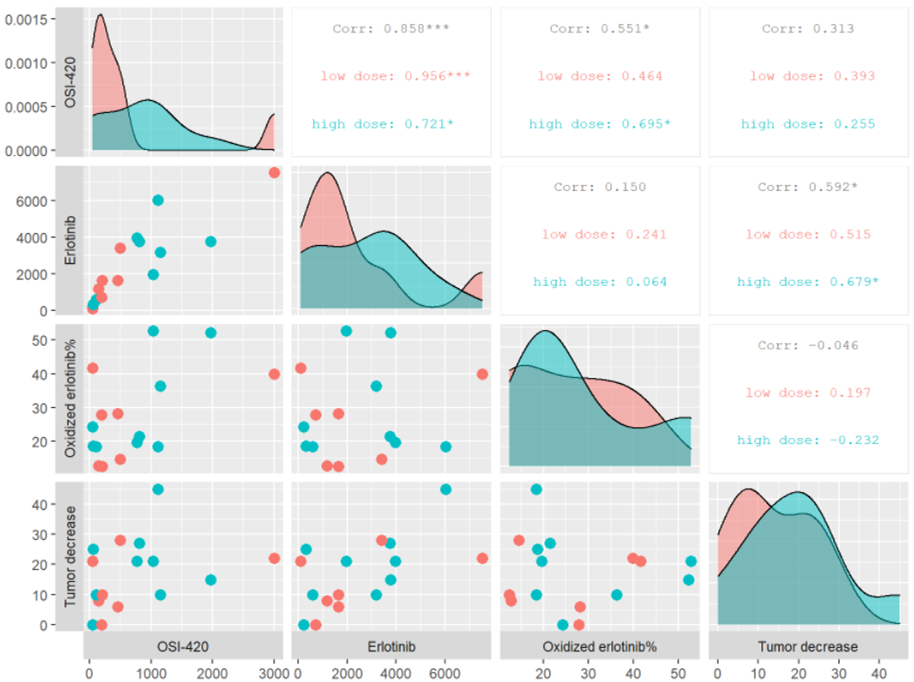
(slides)
- Analyzed correlations between redox-related metabolites in head and neck cancer patients and their responses to a cancer treatment
- Built a multiple linear regression model using the forward selection based on adjusted R2 method
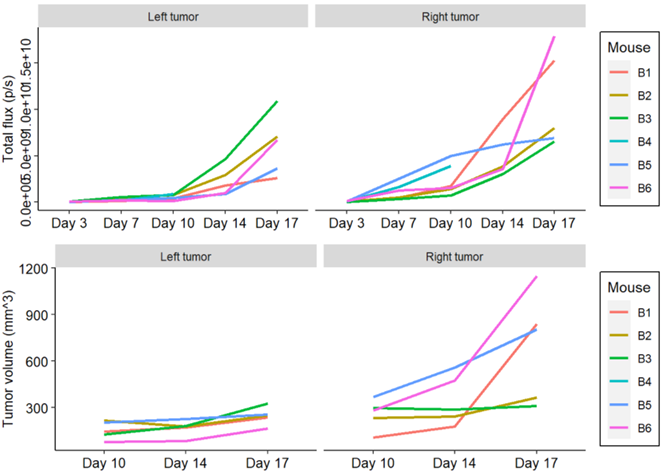
Mouse tumor growth trend analysis
ATP Tennis Analytics
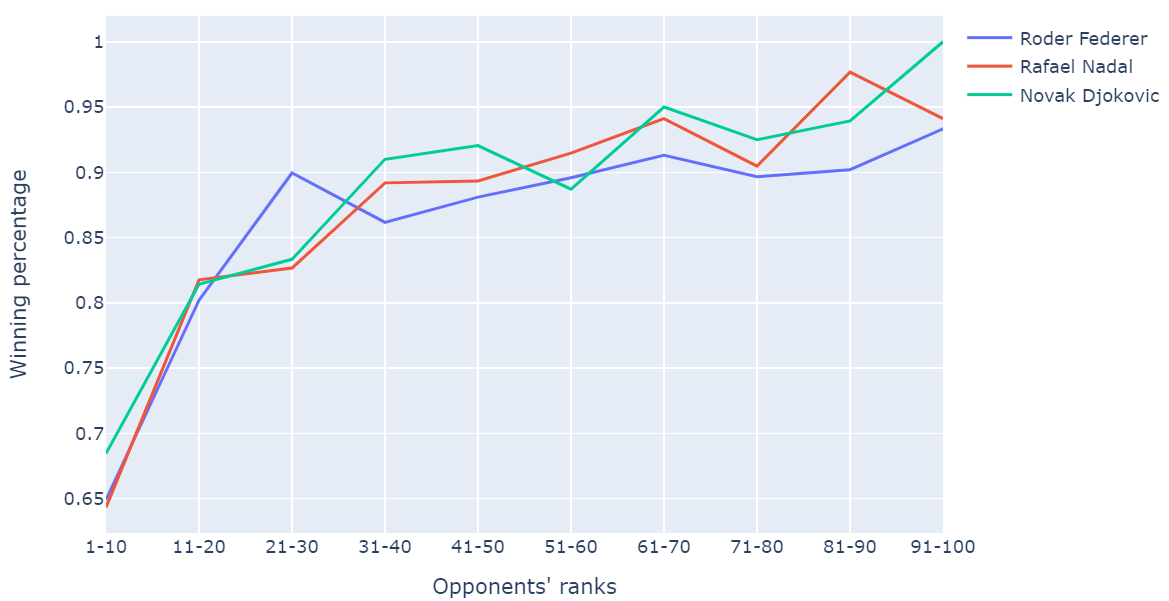
- Analyzed over 63,000 men’s professional tennis matches from 2000 to 2020
- Examined the statistics on upset rate and the impact of winning the first set on the whole match
- Created interactive visualizations for top players’ ranking and performance comparisons